Twitter Follow

Thursday, September 7, 2017

Democratic and Republican Party Could Be Minority Parties by 2018 General Election

As the trend in voter share favoring Non-Partisan and minor parties continues, (click here for August, 2017 data) it now appears that come the 2018 general election, more voters could be registered to vote in those categories than will be registered as either Democratic or Republican. If the change in voter share between August 2016 and August 2017 is applied, those registered as Non-Partisan or as a member of a minor party will be over 30 percent. Among voters 18 to 34 years old, that number will be over 40 percent. And while not quite reaching parity, this number will be over 25 percent in the rural counties and over 20 percent among those 55 years of age and older. These numbers are an estimate based on the past year’s change in voter share. My personal opinion is they will be higher. I doubt they’ll be lower.  

Back to last month. On the outward appearance, minor parties appear to have fallen in August, 2017. However, the decrease is due to a glitch where the system assigned new voters who did not specify a party to “other” rather than “Non-Partisan.” Bottom line, the two major parties lost voter share.

Again, the GOP did not lose as badly as the Democratic Party. While the Democratic Party lost voter share across all demographics and almost all state senate and assembly districts, the GOP remained unchanged state-wide and had slight increases in voter share in Clark County, the rural counties, and among those 18 to 34 years of age. The GOP also gained voter share in more state senate and assembly district than they lost share.  

State-Wide
Party
Change in # Voters
% Change
% Voter Share
Difference in Voter Share %
D
603
0.10
39.14
-0.09
R
1,657
0.34
33.10
0.00
NP
3,518
1.13
21.21
0.17
Other
-988
-1.01
6.55
-0.09
Total not D or R


27.76
0.08
Other includes IAP, Lib, and 5 parties without ballot access.
Change is # voters: IAP +0.40%; Lib +0.80%; other 5 parties -7.30%

Clark County
Party
Change in # Voters
% Change
% Voter Share
Difference in Voter Share %
D
1,011
0.23
42.75
-0.13
R
1,905
0.63
28.85
0.03
NP
3,499
1.53
22.17
0.22
Other
-947
-1.43
6.24
-0.12
Total not D or R


28.41
0.10
Other includes IAP, Lib, and 5 parties without ballot access.
Change is # voters: IAP +0.68%; Lib +0.93%; other 5 parties -9.47%
  
Washoe County
Party
Change in # Voters
% Change
% Voter Share
Difference in Voter Share %
D
-104
-0.12
35.33
-0.04
R
-116
-0.12
37.53
-0.05
NP
199
0.40
19.98
0.08
Other
34
0.19
7.16
0.01
Total not D or R


27.14
0.09
Other includes IAP, Lib, and 5 parties without ballot access.
Change is # voters: IAP +0.33%; Lib +0.68%; other 5 parties -0.69
  
Rural Counties
Party
Change in # Voters
% Change
% Voter Share
Difference in Voter Share %
D
-304
-0.68
23.94
-0.07
R
-132
-0.14
51.13
0.12
NP
-180
-0.55
17.46
-0.03
Other
-75
-0.54
7.47
-0.01
Total not D or R


24.93
-0.04
Other includes IAP, Lib, and 5 parties without ballot access.
Change is # voters: IAP -0.68%; Lib +0.36%; other 5 parties -0.73%

18 – 34 Year Old
Party
Change in # Voters
% Change
% Voter Share
Difference in Voter Share %
D
-172
-0.11
39.22
-0.14
R
448
0.50
22.55
0.06
NP
1,231
1.04
30.06
0.24
Other
-525
-1.59
8.16
-0.15
Total not D or R


38.22
0.09
Other includes IAP, Lib, and 5 parties without ballot access.
Change is # voters: IAP +0.31%; Lib +0.58%; other 5 parties -7.47%

 55+
Party
Change in # Voters
% Change
% Voter Share
Difference in Voter Share %
D
535
0.22
39.65
-0.06
R
858
0.35
40.50
-0.01
NP
999
1.13
14.60
0.11
Other
-116
-0.36
5.25
-0.04
Total not D or R


19.85
0.07
Other includes IAP, Lib, and 5 parties without ballot access.
Change is # voters: IAP +0.41%; Lib +1.01%; other 5 parties -6.15%

Major party loses also continue in congressional and legislative districts.

Congressional Districts
Party
# Districts Lose Voter Share
# Districts Gain Voter Share
# Districts No Change
Democratic
4
0
0
Republican
1
2
1
Non-Partisan
0
4
0
Other
3
0
1
Both CD 1, CD 2, and CD 4 continue to show the number of voters not affiliated with either major party is greater than or within 5% of the number of voters registered to one of the major parties.

State Senate Districts
Party
# Districts Lose Voter Share
# Districts Gain Voter Share
# Districts No Change
Democratic
20
1
0
Republican
6
13
2
Non-Partisan
1
19
1
Other
18
2
1
In 15 districts (71.4%) the number of voters registered as Non-Partisan or the total number not affiliated with either major party is greater than or within 5% of the number of voters registered to one of the major parties. Note the Democratic Party continues a major loss of voter share. parties gained voter share in all districts.

 State Assembly Districts
Party
# Districts Lose Voter Share
# Districts Gain Voter Share
# Districts No Change
Democratic
38
4
0
Republican
17
23
2
Non-Partisan
3
38
1
Other
35
6
1
In 31 districts (73.81%) the number of voters registered as Non-Partisan or the total number not affiliated with either major party is greater than or within 5% of the number of voters registered to one of the major parties. This is unchanged from last month. As in the senate, the Democratic Party continues to experience a major loss of voter share.


As Nevadans continue to lose confidence in the both the Democratic and Republican Party, look for exciting news in the near future from Nevadans for Election Reform.
Saturday, August 5, 2017

Partisanship Continues to Define and Divide Us

In two recent polls by Pew Research Center, partisanship in the United States continues to define us and divide us as a nation. This trend has been with us for almost a decade, and with these two reports, shows no sign of changing.

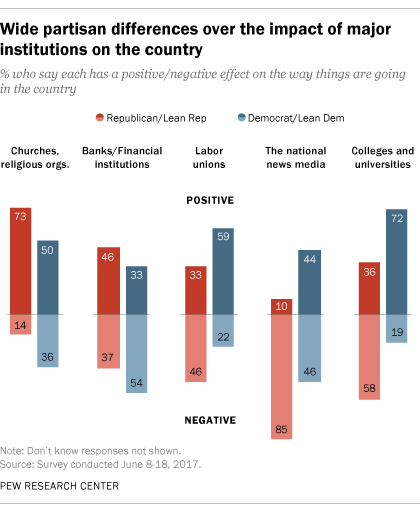
In a poll released July 10, 2017, the organization found that opinion of national institutions; churches / religious organizations, banks / financial institutions, labor unions, the national news media, and colleges / universities, and the impact they have on the nation differs based on political party. The study, Sharp Partisan Divisions in Views of National Institutions”, shows significant differences in four of the five areas.

Wide partisan differences over the impact of major institutions on the country

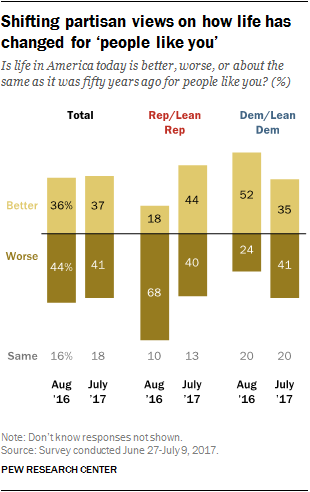
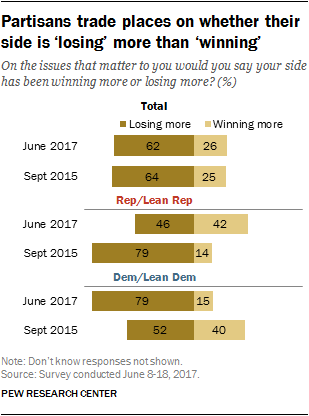
In the second poll, Partisan Shifts in Views of the Nation, but Overall Opinions Remain Negative; Just 26% say ‘their side’ wins more often than it loses in politics” released August 4, 2017 Pew looks at how people view their station in life and how they view the political landscape for “people like them”. It is interesting to note that with the change of the presidency from Democratic to Republican, the percentage who believes their side loses more also switched. In September, 2015, 79 percent of Republicans felt their side loses more. In June, 2017, 79 percent of Democrats feel that way.

Shifting partisan views on how life has changed for ‘people like you’

Partisanship continues to define and divide us as a nation. Those familiar with this blog know this is not the first Pew Research study I have highlighted. Voter frustration with what has been called “tribal” behavior is manifesting itself by voters abandoning both the Democratic and Republican Party, registering without party affiliation; Non-Partisan in Nevada, or in one of the minor political parties.


I believe the political parties will not willingly make the changes needed to reverse this trend and return to a political climate that fosters collaboration and problem solving, where we track wins or loses not by political party but by impact on Americans. After two attempts to have the Nevada legislature act, I am relatively certain it is the voters who will have to make the change. Nevadans for Election Reform is leading this effort in Nevada.                                                    

Tuesday, August 1, 2017

Major Political Parties’ Downward Slide Continues

Can the Democratic and Republican Party in Nevada stop the downward slide in voter share? Looking at the just released voter registration statistics for July, 2017, it does not look like it. The only bright spot for the Republican Party was in the rural counties where they had a slight gain in voter share. Except for that, both the major parties lost voter share across all tracked demographics. As has been the trend, both Non-Partisan and the minor parties gained share.

The bad news does not stop there. For the second consecutive month, the Democratic Party lost voter share in all 21 state senate districts and all but one state assembly district. In the state’s congressional districts, for the first time, both Non-Partisan and minor parties gained voter share in all four districts.

State-Wide
Party
Change in # Voters
% Change
% Voter Share
Difference in Voter Share %
D
1,218
0.21
39.23
-0.08
R
1,574
0.32
33.10
-0.03
NP
1,823
0.59
21.04
0.04
Other
1,340
1.38
6.64
0.06
Total not D or R


27.68
0.10
Other includes IAP, Lib, and 5 parties without ballot access.
Change is # voters: IAP +0.63%; Lib +0.96%; other 5 parties +4.46%

Clark County
Party
Change in # Voters
% Change
% Voter Share
Difference in Voter Share %
D
952
0.21
42.88
-0.08
R
888
0.30
28.81
-0.03
NP
1,189
0.52
21.95
0.03
Other
1,.192
1.83
6.36
0.09
Total not D or R


28.31
0.12
Other includes IAP, Lib, and 5 parties without ballot access.
Change is # voters: IAP +0.71%; Lib +1.11%; other 5 parties +5.97%

Washoe County
Party
Change in # Voters
% Change
% Voter Share
Difference in Voter Share %
D
329
0.37
35.37
-0.08
R
526
0.56
37.58
-0.02
NP
534
1.08
19.90
0.09
Other
133
0.75
7.15
0.01
Total not D or R


27.05
0.10
Other includes IAP, Lib, and 5 parties without ballot access.
Change is # voters: IAP +0.95%; Lib +0.89%; other 5 parties -0.03


Rural Counties
Party
Change in # Voters
% Change
% Voter Share
Difference in Voter Share %
D
-63
-0.14
24.01
-0.06
R
160
0.17
51.01
0.03
NP
100
0.31
17.50
0.03
Other
15
0.11
7.49
0.00
Total not D or R


24.99
0.03
Other includes IAP, Lib, and 5 parties without ballot access.
Change is # voters: IAP +0.01%; Lib +0.36%; other 5 parties +0.64%

18 – 34 Year Old
Party
Change in # Voters
% Change
% Voter Share
Difference in Voter Share %
D
173
0.11
39.36
-0.09
R
237
0.27
22.50
-0.02
NP
456
0.39
29.83
0.02
Other
453
1.39
8.32
0.09
Total not D or R


38.15
0.11
Other includes IAP, Lib, and 5 parties without ballot access.
Change is # voters: IAP +0.40%; Lib +1.10%; other 5 parties +3.86%

55+
Party
Change in # Voters
% Change
% Voter Share
Difference in Voter Share %
D
724
0.30
39.71
-0.06
R
1,063
0.43
40.51
-0.01
NP
602
0.69
14.49
0.03
Other
404
1.27
5.29
0.04
Total not D or R


19.78
0.07
Other includes IAP, Lib, and 5 parties without ballot access.
Change is # voters: IAP +0.76%; Lib +0.94%; other 5 parties +4.82%

 Major party loses also continue in congressional and legislative districts.

Congressional Districts
Party
# Districts Lose Voter Share
# Districts Gain Voter Share
# Districts No Change
Democratic
4
0
0
Republican
4
0
0
Non-Partisan
0
4
0
Other
0
4
0
Both CD 1, CD 2, and CD 4 continue to show the number of voters not affiliated with either major party is greater than or within 5% of the number of voters registered to one of the major parties. Note that Non-Partisan and minor parties gained voter share in all districts.

State Senate Districts
Party
# Districts Lose Voter Share
# Districts Gain Voter Share
# Districts No Change
Democratic
21
0
0
Republican
16
3
2
Non-Partisan
2
17
2
Other
0
21
0
In 15 districts (71.4%) and an increase of one over June, the number of voters registered as Non-Partisan or the total number not affiliated with either major party is greater than or within 5% of the number of voters registered to one of the major parties. Note the Democratic Party lost voter share in all districts for the second consecutive month. At the same time, minor parties gained voter share in all districts.

State Assembly Districts
Party
# Districts Lose Voter Share
# Districts Gain Voter Share
# Districts No Change
Democratic
41
1
0
Republican
20
19
3
Non-Partisan
11
27
4
Other
7
34
1
Unchanged. In 31 districts (73.81%) the number of voters registered as Non-Partisan or the total number not affiliated with either major party is greater than or within 5% of the number of voters registered to one of the major parties. This is unchanged from last month. For the second consecutive month, the Democratic Party lost voter share in all but one district.


Senate bill 103 this last session attempted to address this trend. Senate Majority Leader Aaron Ford (D – Las Vegas) refused to give the bill a hearing. Not addressing the problem will not make it go away.